Clinicians do not receive all the information about a patient at once. This framework predicts tuberculosis treatment outcomes in stages, so a useful estimate is available at each point in care rather than only at the end.
Reading the figure
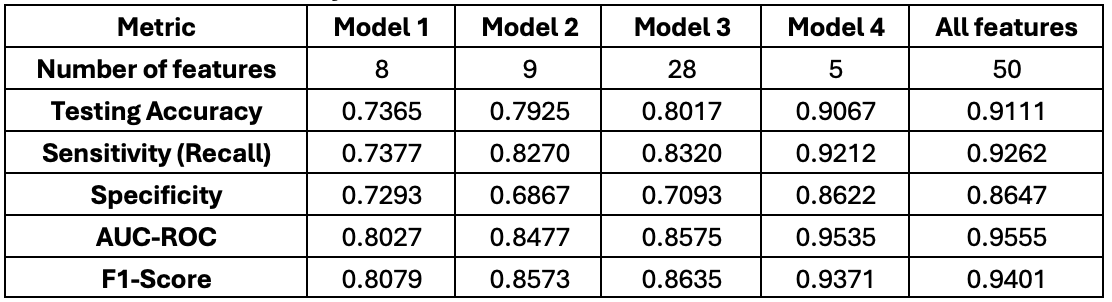
Each column is a model trained on a different subset of the available features, with the number of features it uses in the first row.
The comparison that matters is Model 4 against All features. Model 4 uses five inputs and reaches 0.9067 testing accuracy and 0.9535 AUC-ROC. The full fifty-feature model reaches 0.9111 and 0.9555. Dropping forty-five of the fifty inputs costs under half a percentage point. That is the result the project turns on, because in the resource-constrained settings this was built for most of those fifty fields are simply never collected. The table says a usable prediction is available from a handful that are.
One pattern is worth reading across the whole table rather than down a single column. Specificity is consistently the weakest metric, running from 0.73 to 0.86 while sensitivity runs from 0.74 to 0.93. These models are readier to flag a patient as at risk than to clear one. For a triage tool that is the right direction to err, but it does mean a positive prediction is a reason to look more closely, not a conclusion on its own.
Approach
- Multi-stage gradient boosted decision tree (XGBoost) models, one per clinical checkpoint
- Combines genomic features, patient metadata and radiological information
- Built on TB Portals data, and designed to degrade gracefully when fields are missing
Results
- Strong predictive performance, strongest at the early checkpoints where a prediction is most actionable
- Feature-level analysis surfaces which inputs drive each prediction, supporting clinical decision-making
- A five-feature model performs within half a point of the full model, which is what makes it deployable